Stop Guessing Your Energy Costs. Start Optimizing.
Your meters feed the EnergyMeterData platform—live KPIs, real-time electrical parameters, load-wise consumption, demand views, and audit-style reporting in one place.
- ✓ Platform dashboards & graphs from your actual site data
- ✓ Demand monitoring, alerts, SLD & multi-site roll-up
- ✓ Built-in AI and exports auditors can work seamlessly with complete, accurate data.

How it works
One platform between your plant and your auditors
EnergyMeterData connects meters, delivers the platform experience you see in these previews, and keeps audit delivery transparent.
- Customer — Meters and assets on energymeterdata.com; data, SLD, and readiness in one place.
- EnergyMeterData — Monitoring, reports, asset tools, and a fair marketplace for audit services.
- Auditor — Bids, scope, and delivery — you choose who audits, end to end.
Platform intelligence
Built to reduce waste, not just show data
Live load, billing-friendly exports, alerts, and sustainability signals — the same ideas you use inside the platform.
- Live load & demand — real-time kW and demand to avoid peak penalties.
- Automated billing views — monthly consumption summaries and export-friendly layouts.
- Smart alerts — instant signals when thresholds are exceeded.
- Carbon & CO₂ context — track usage and emissions for sustainability goals.
Platform overview
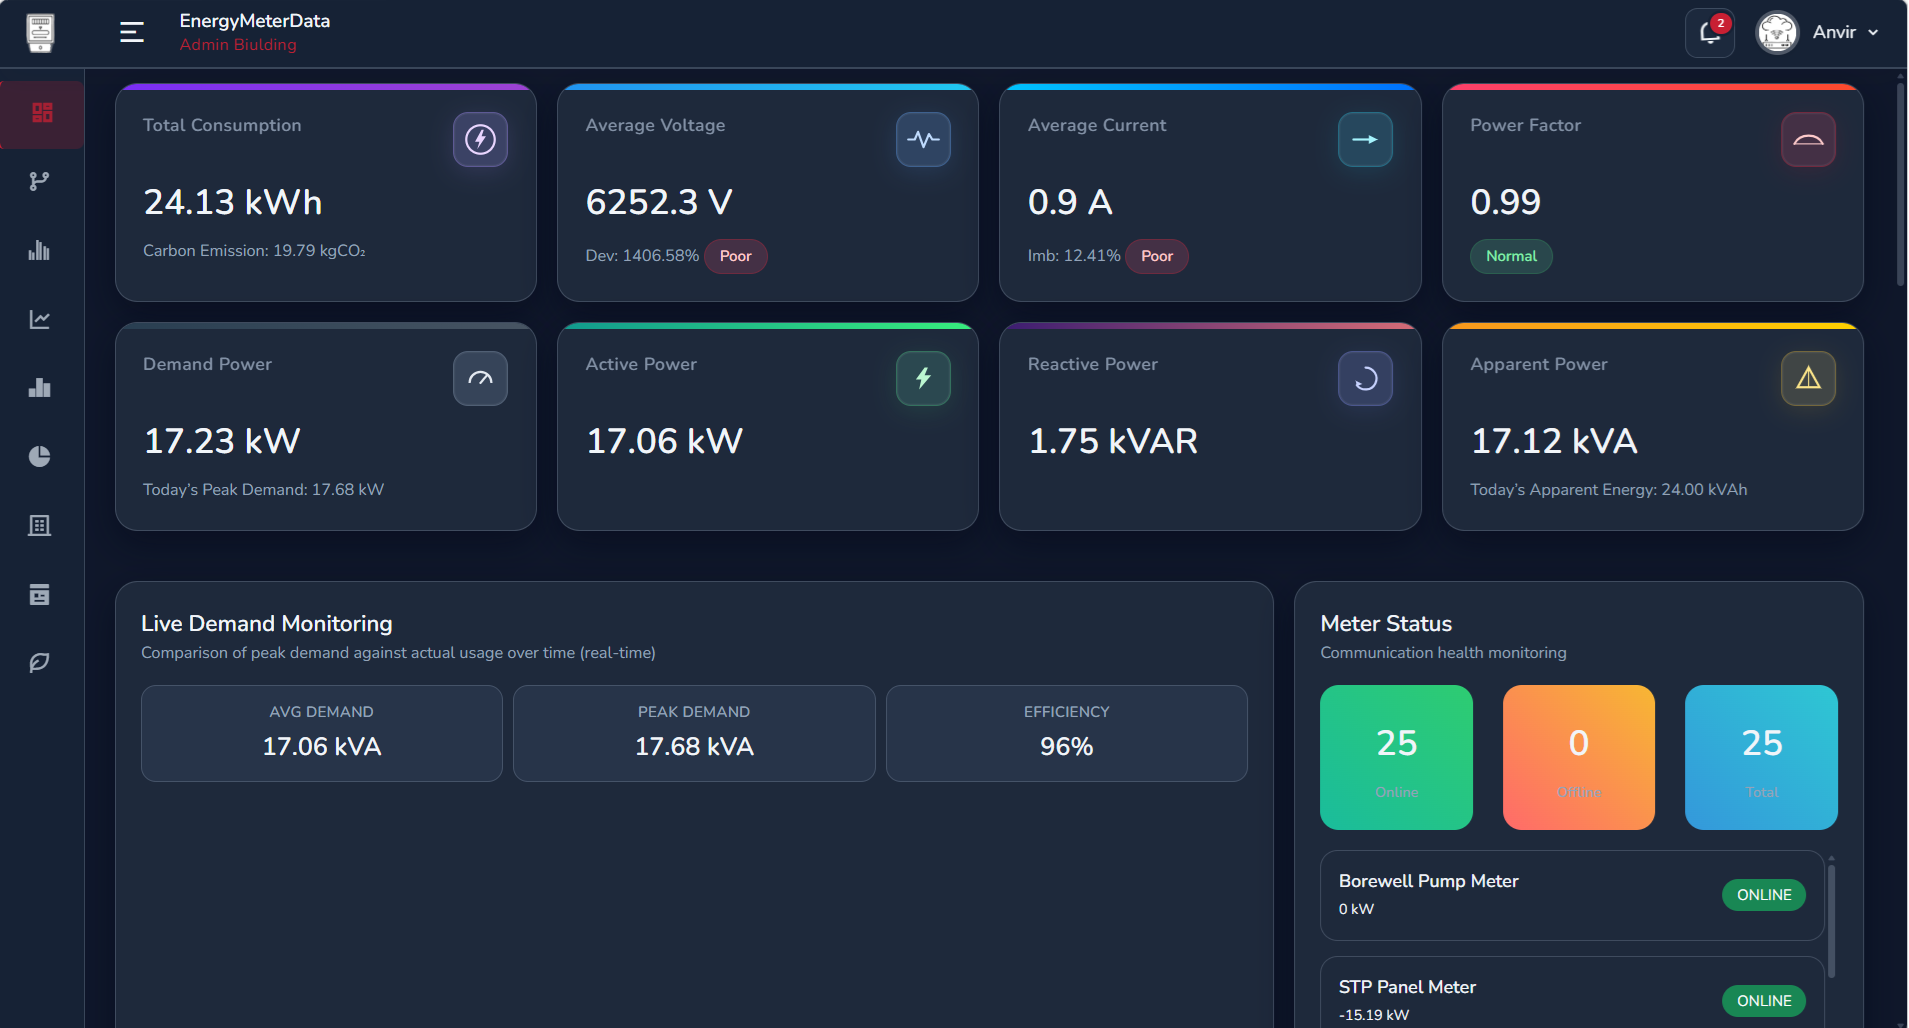
Dashboards designed for operators
Industrial meters stream into EnergyMeterData. The platform turns readings into demand views, live parameters, and consumption breakdowns — so every site rolls up honestly.
Real-time monitoring
Every parameter, as the meter sends it
Voltage, current, power, power factor, frequency, and energy—aligned with the live panels in your platform.
- Per-phase voltage & current for balance and overload checks
- Active, reactive & apparent power plus kWh for billing context
- Unified dashboard with alerts and history
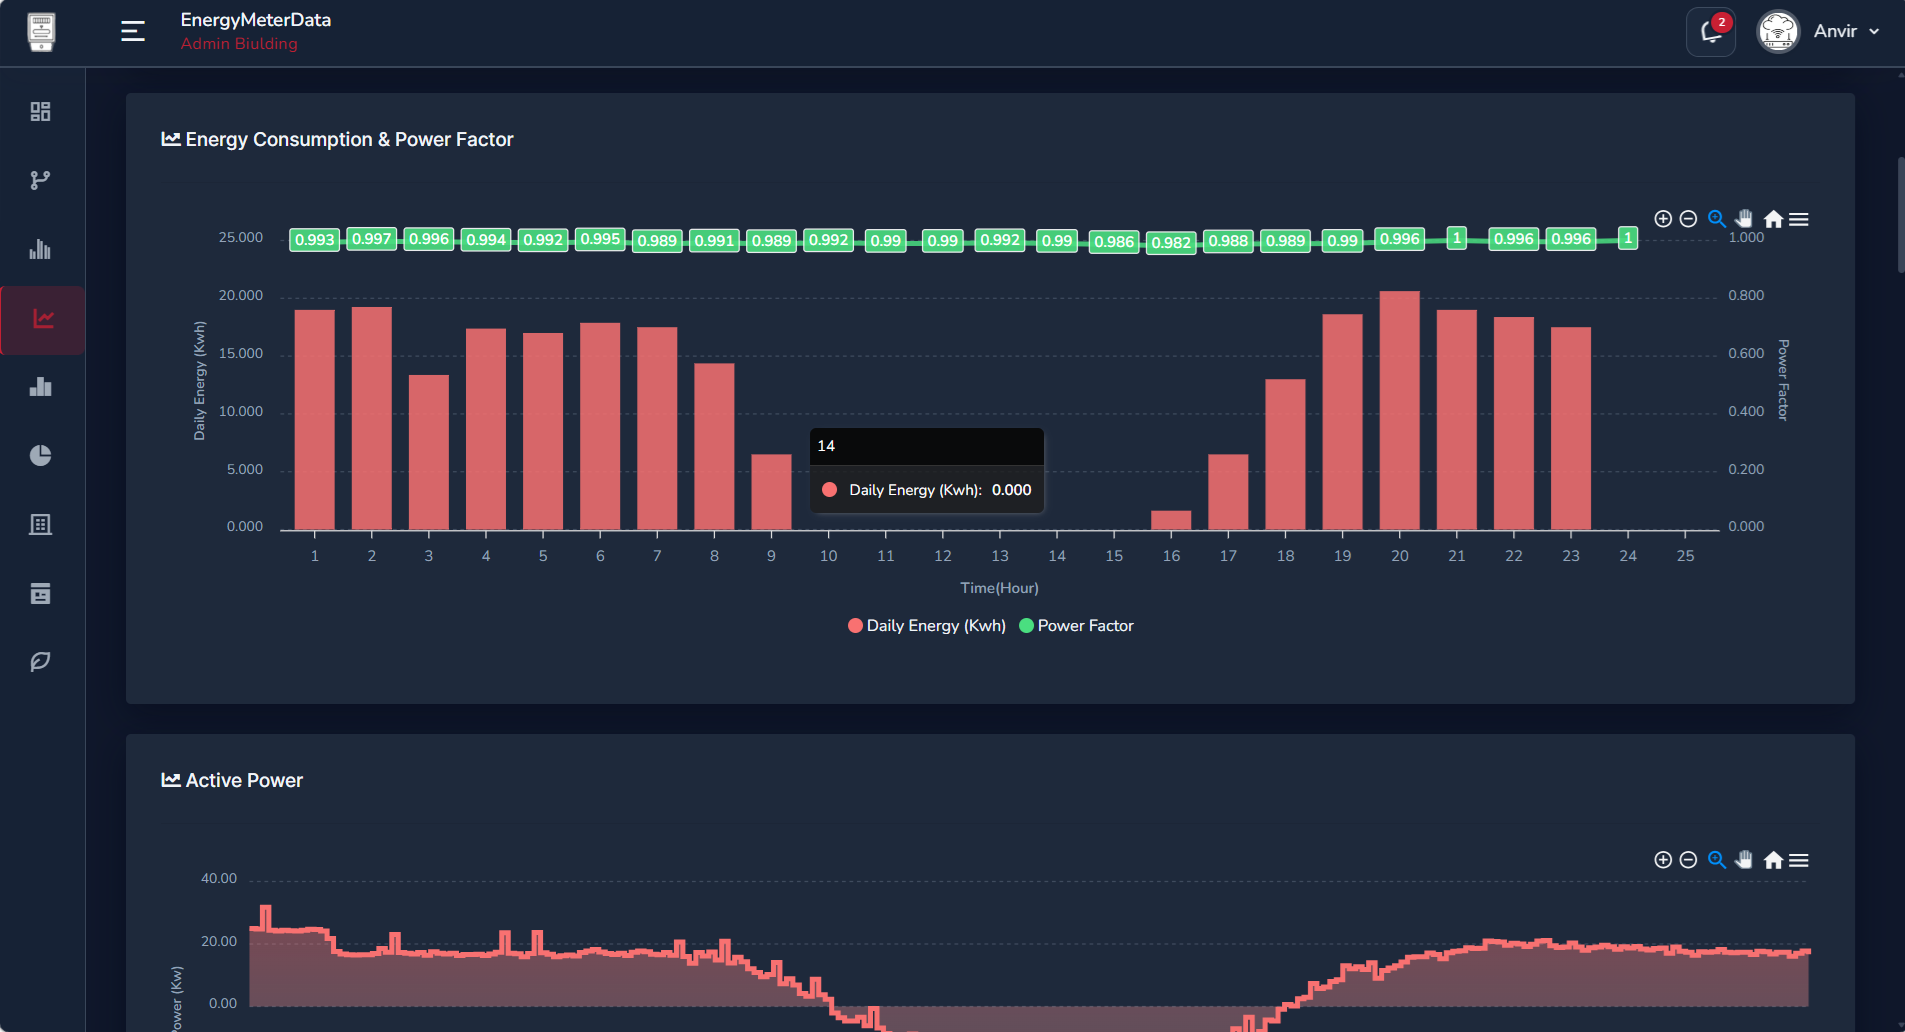
Energy analytics
Patterns, demand, and power factor in context
Daily and monthly views, peak events, and load-wise breakdowns—the same analytics modules your team uses after data is flowing.
- Daily energy graphs & peak / off-peak split
- Month-over-month trends and seasonality
- Demand monitoring & power-factor tracking
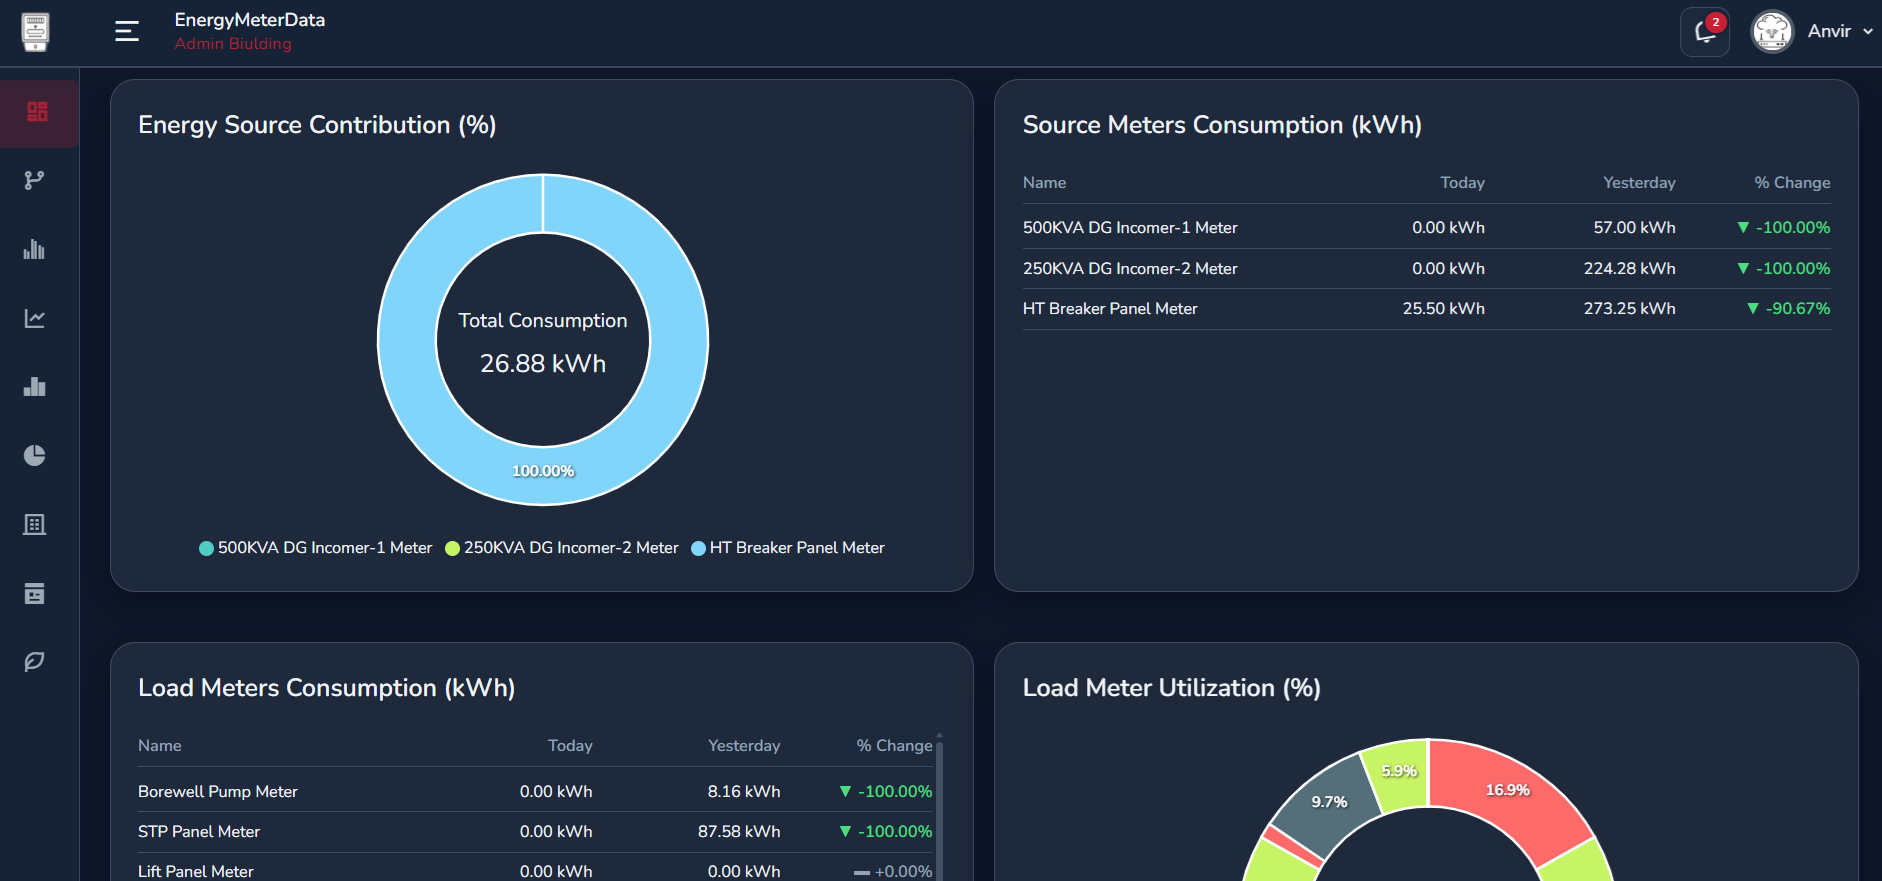
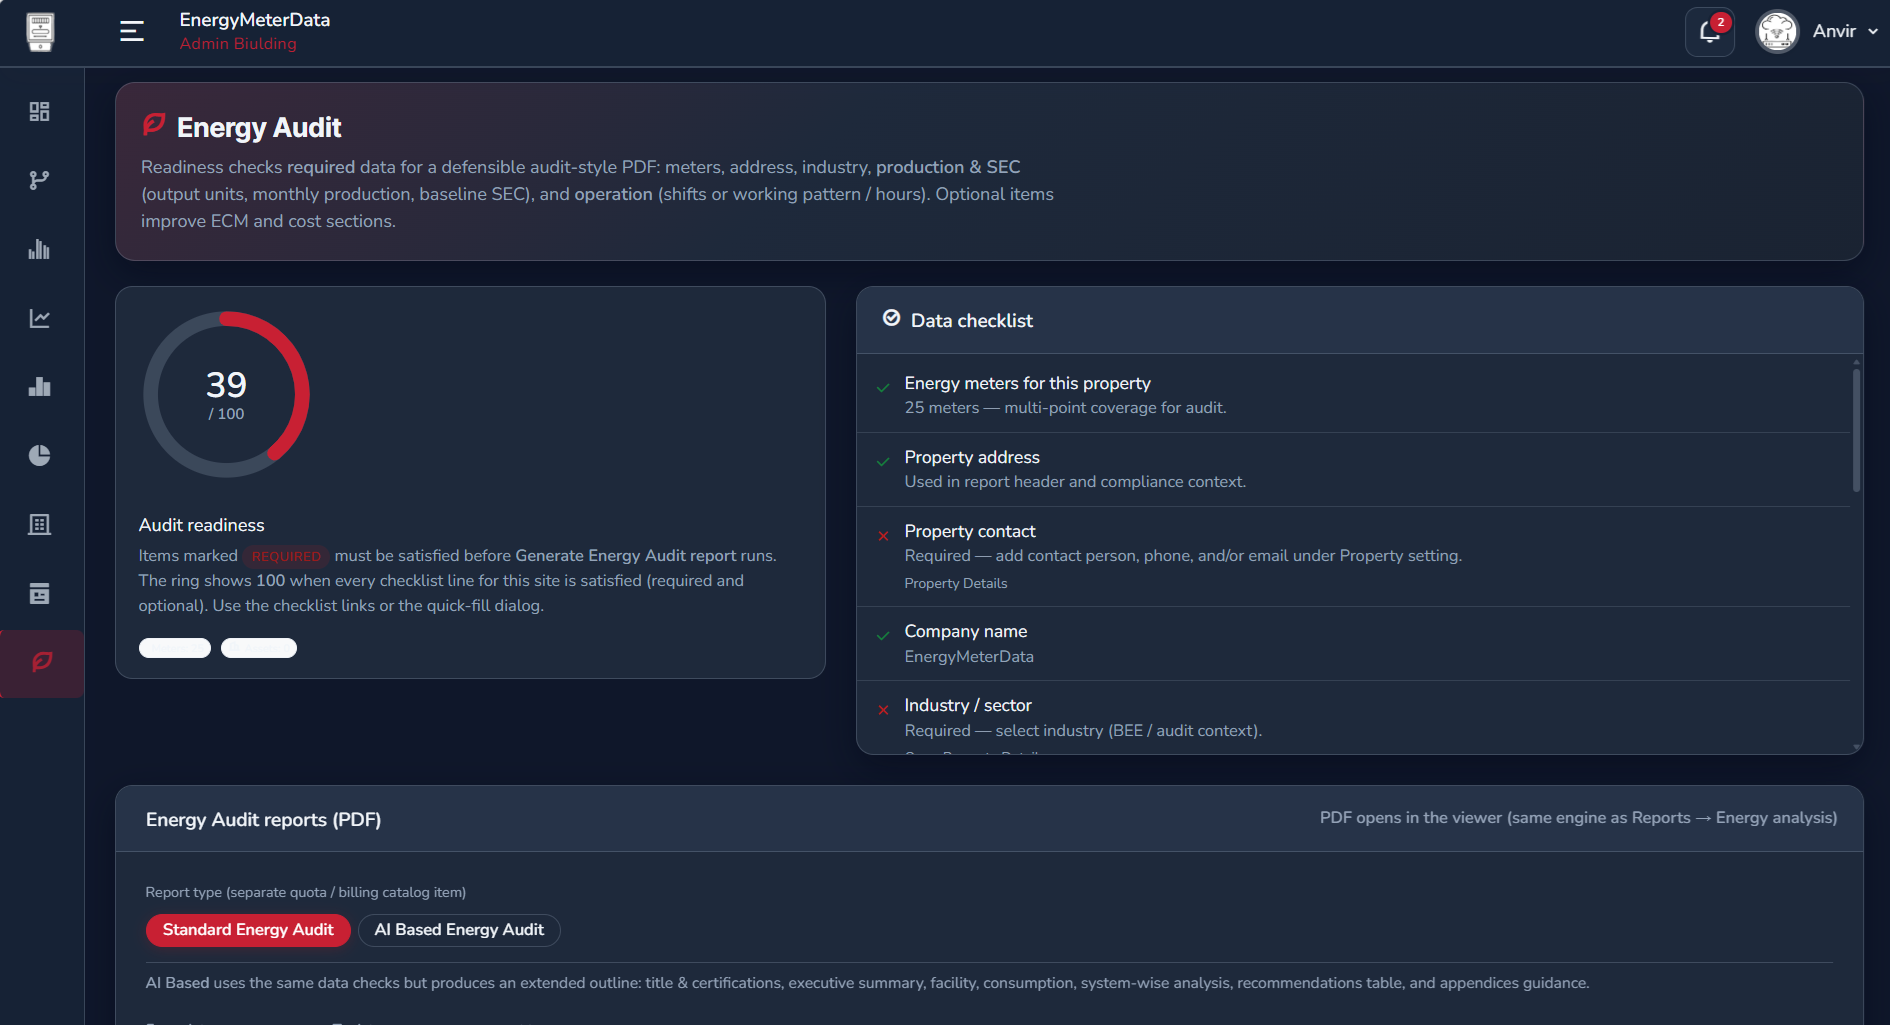
Reports & assets
Audit-ready output and asset intelligence
Structured report views, AI-assisted patterns, asset register, maintenance reminders, and SLD-style topology.
- Export-friendly layouts for auditor handoff
- Consumption summaries, demand snapshots, PF & quality highlights
- Assets linked to meters, panels, and lines
Link meters to equipment and departments.
Due reminders in-app and by email.
See how meters and assets connect across your electrical system.
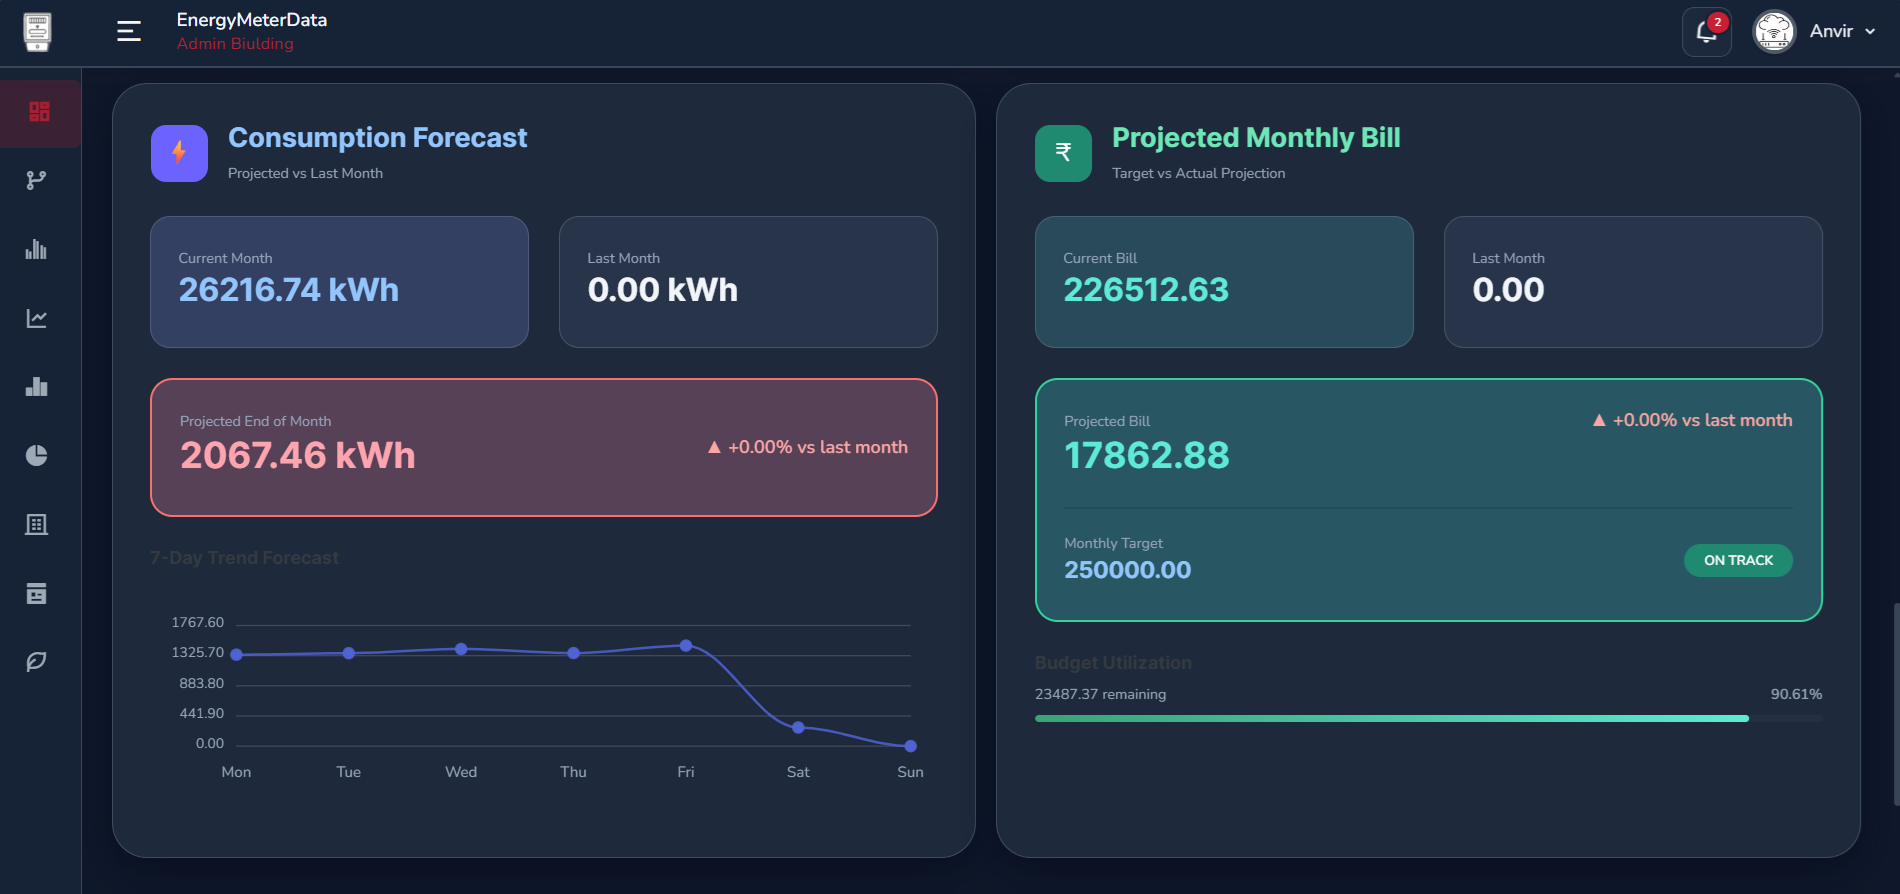
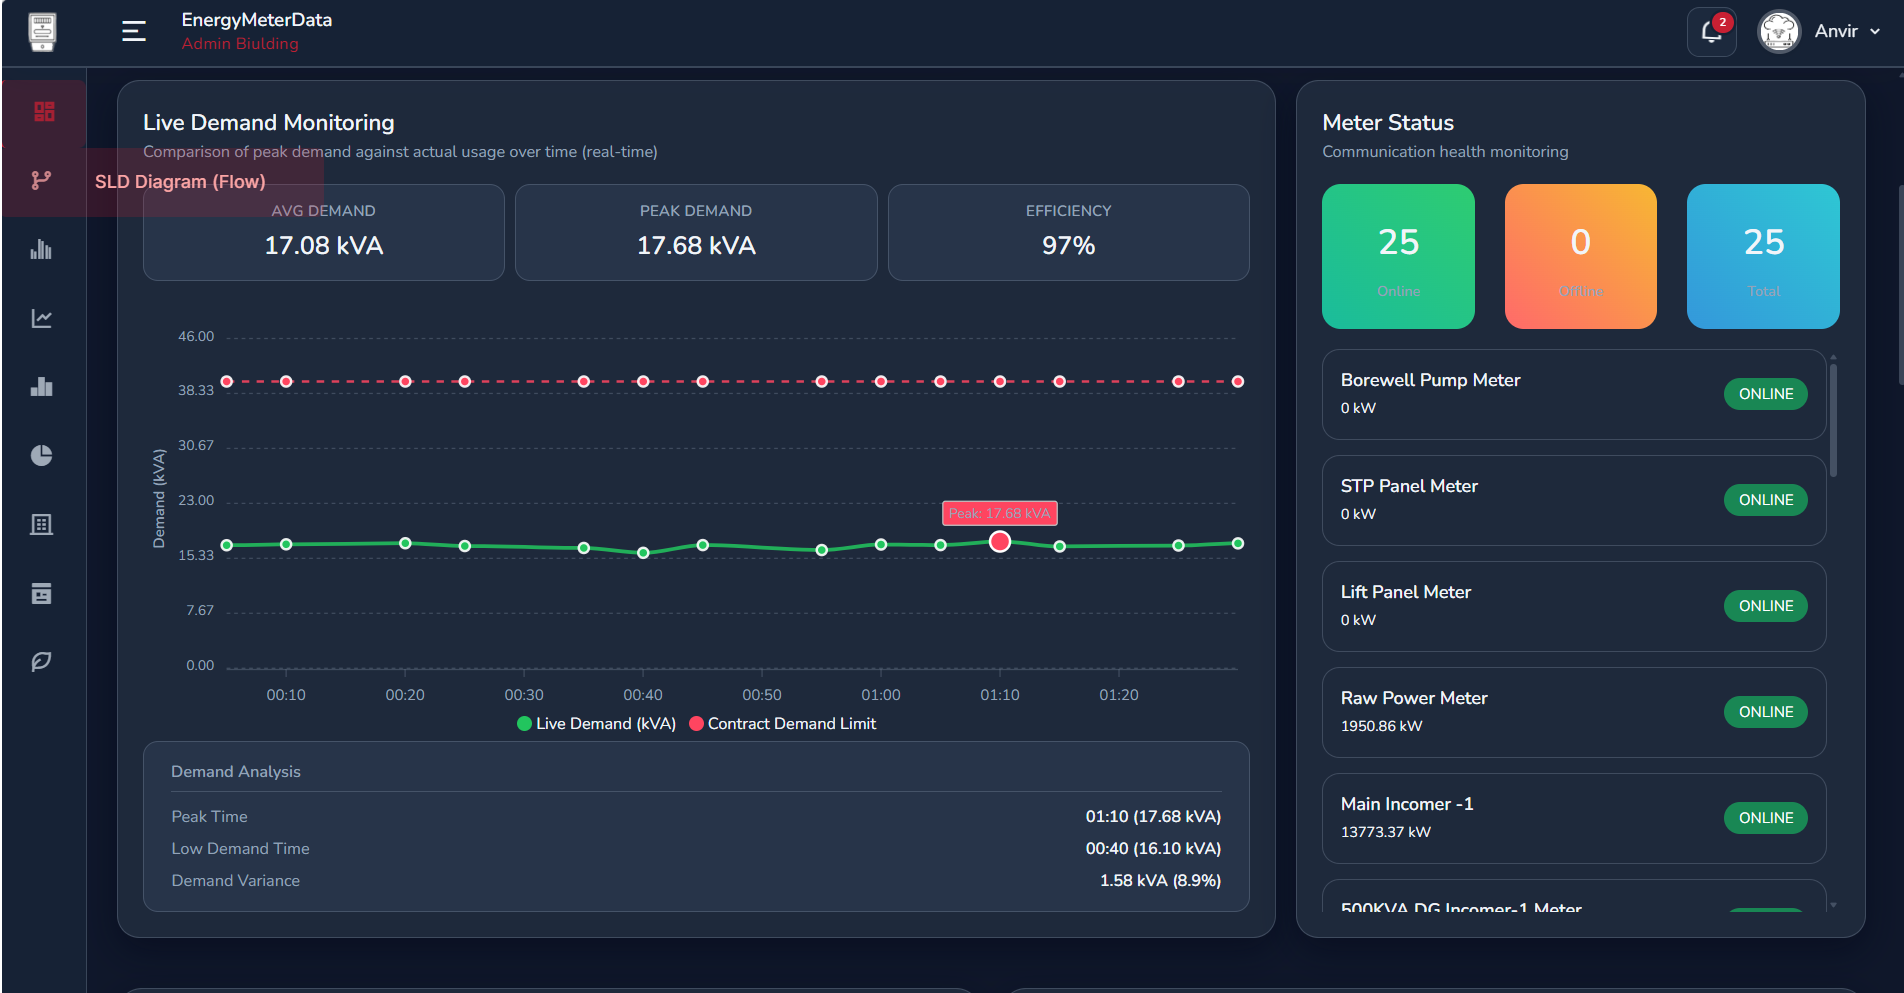
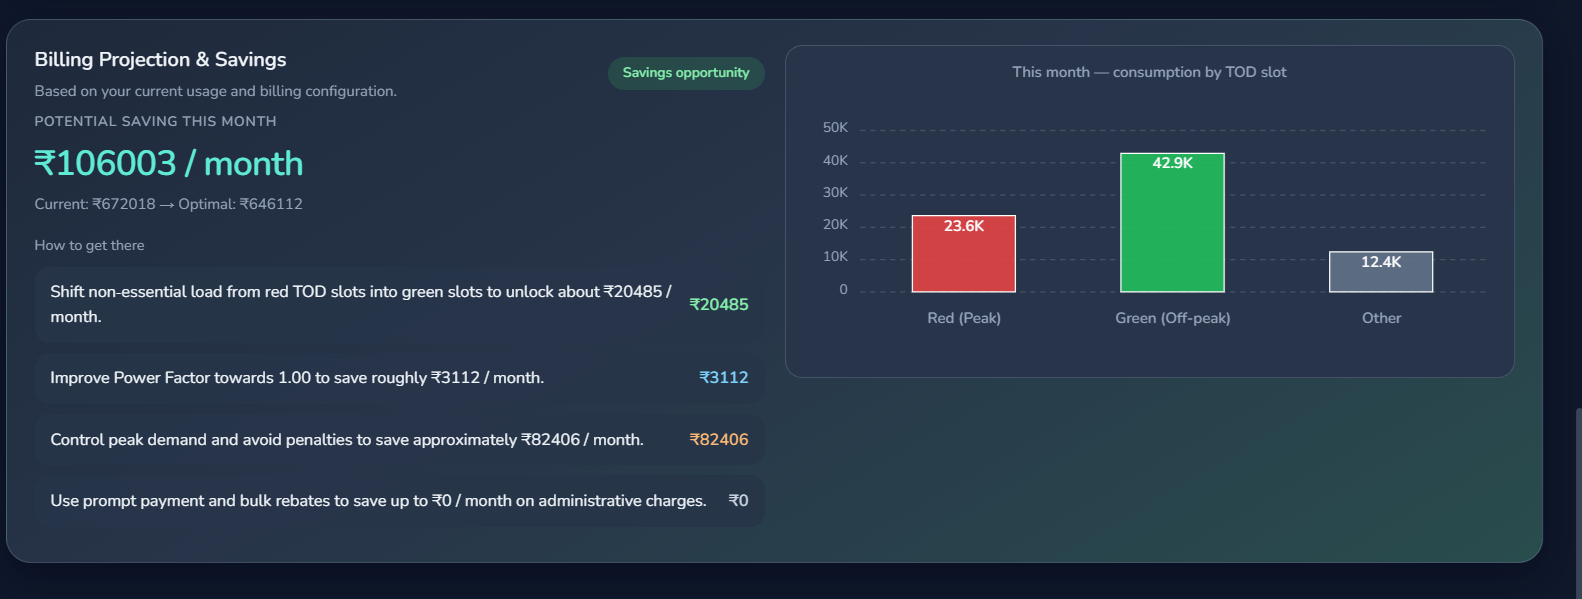
Optimization
Energy analysis like an audit—before the auditor arrives
Forecasting and trends in the platform help you catch waste, idle load, peaks, and power-factor issues early.
Energy waste
Unnecessary consumption and idle equipment.
Peak demand
What drives demand charges and how to shift load.
Idle baseload
Standby draw that inflates the bill.
Power factor
Detect poor PF and plan corrective action.
Reduce cost by finding inefficiencies in data—often before a full external audit.
Industry Use Cases
Built for industries and commercial buildings:
Manufacturing
Factories & plants
Commercial
Office buildings
Hospitals
Healthcare facilities
Shopping Malls
Retail & malls
Data Centers
IT & server rooms
Benefits
Outcomes that scale with your meters
Monitoring, analytics, audit readiness, AI guidance, multi-site operations, and RBAC—from the same platform experience.
- Lower cost — waste, demand spikes, idle load.
- Efficiency KPIs — PF, demand, SEC trends.
- Alerts — anomalies and threshold breaches.
- Multi-site — one roll-up across plants.
- RBAC support — roles and permissions so teams only see what they are allowed to manage.
- Audit-ready — evidence, graphs, summaries.
- AI assist — faster savings opportunities.
- Assets & SLD — topology for diagnosis.
- Carbon / ESG — emissions context from usage.
Estimate your ROI in seconds
Move the slider to set your monthly bill. We’ll estimate potential yearly savings with EnergyMeterData.
Hardware agnostic Existing meters & protocols — connect through our gateway stack.
Deployment
Connect · Analysis / Optimize · Save
Multiple plants. One cloud. One control room.
We are hardware agnostic: keep your existing meters and field devices—gateways normalize protocols and stream securely to energymeterdata.com over MQTT (and HTTPS where needed). Teams monitor every site from a single platform.
- Connect — Deploy gateways next to diverse meters (Modbus, DLMS, pulse, MBus, CT/PT, and more). Edge data publishes upstream via MQTT.
- Analysis / Optimize — The cloud service ingests all plants, runs analytics, alerts, and AI-assisted insight in your browser—desktop or wall displays in the control room, all through the same platform.
- Save — Turn visibility into action: cut waste, manage demand, and prove savings with audit-ready history.
Start optimizing your energy today.
See how real-time monitoring and analytics can reduce waste and improve efficiency.
Start optimizing today